How to forecast your government contracts pipeline (the math, the mistakes, and the spreadsheet that won't save you)
A clear guide to building a pipeline forecast for government contracting — the Shipley win-probability math, the stage-by-stage conversion model, and the spreadsheet patterns that fool you into trusting bad numbers.
Most small government contractors don't have a pipeline forecast. They have a spreadsheet with some RFP names and a column called "status" that hasn't been updated since the last quarter ended.
That's not a forecast. A forecast is a number — a dollar amount — that tells you what you can reasonably expect to win in the next 30, 60, or 90 days based on the opportunities you're actually working. It's the difference between knowing you have a problem in March and finding out you have a problem in June when there's no time left to fix it.
This post walks through how to build a real pipeline forecast for government contracting work. The Shipley win-probability math, the stage-by-stage conversion model, and — importantly — the spreadsheet patterns that fool people into trusting numbers they shouldn't.
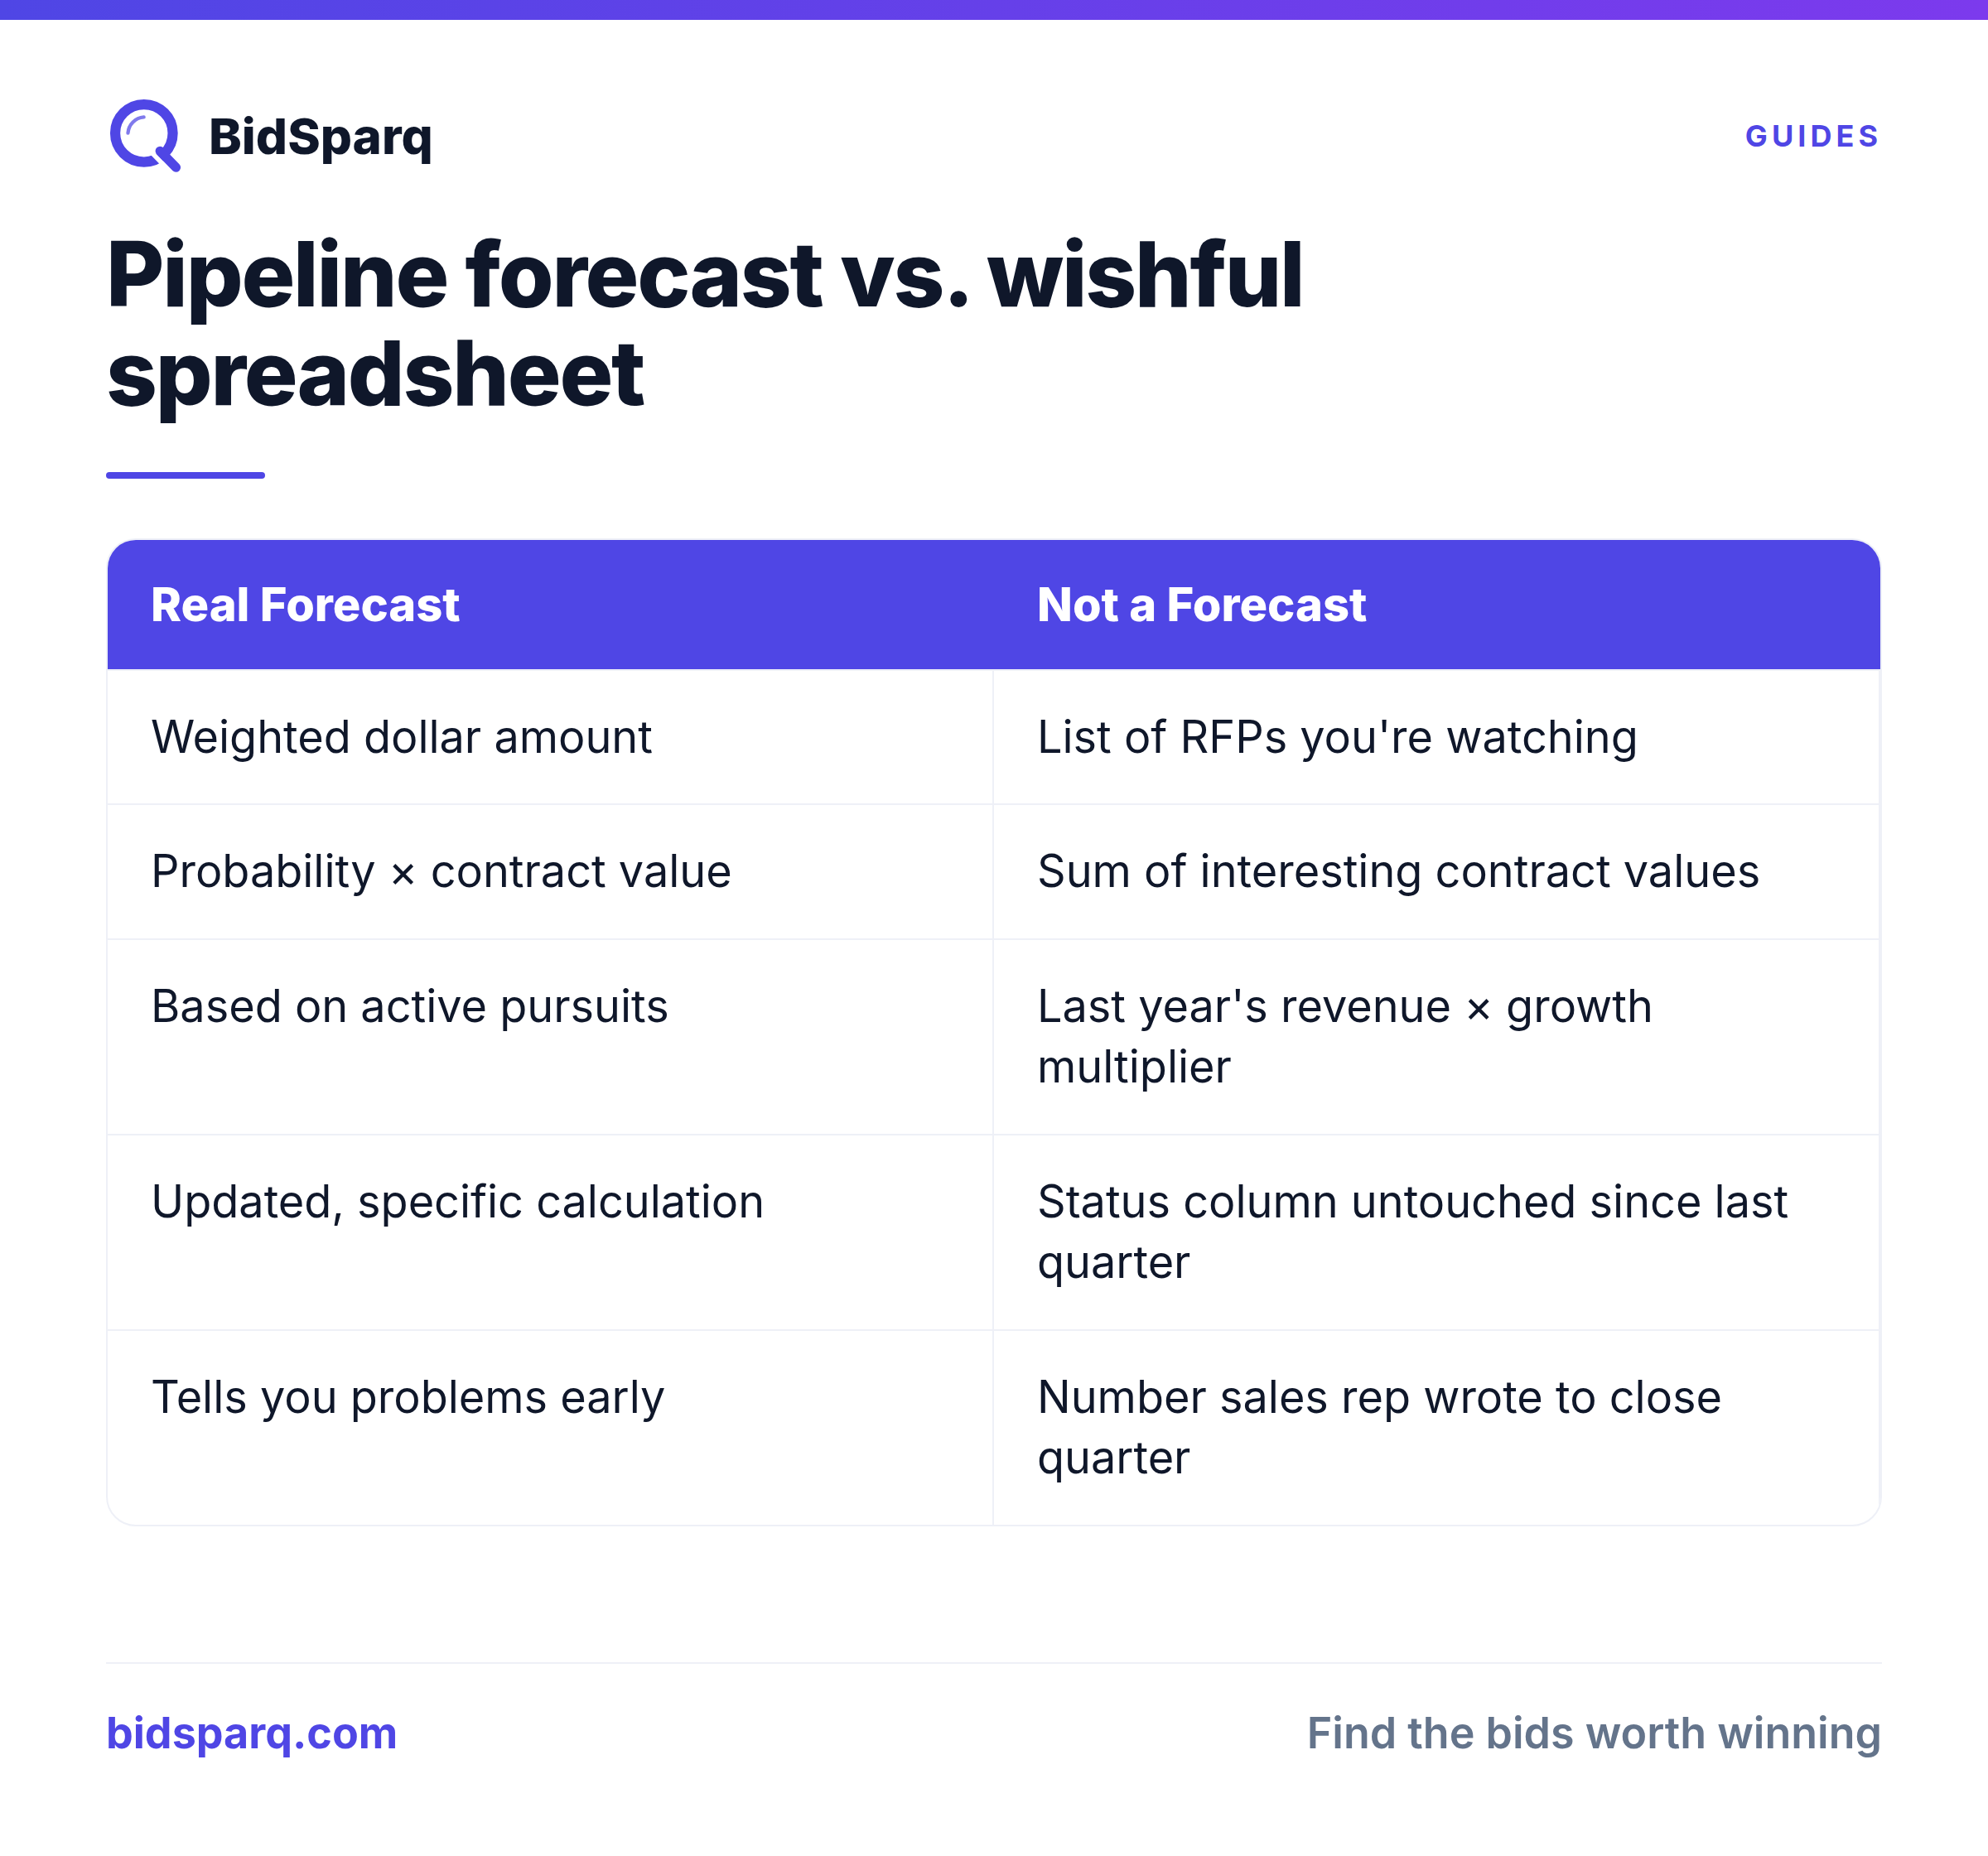
What a pipeline forecast actually is (and isn't)
A pipeline forecast is a single dollar amount: the expected value of all your active pursuits, weighted by their probability of winning.
It is not:
- A list of RFPs you're "looking at"
- The sum of all contract values you've flagged as interesting
- Your last year's revenue × some growth multiplier
- Whatever number your sales rep wrote down to close the quarter
It's the result of a specific calculation: for every opportunity you're working, multiply the contract's probable value by the probability you'll win it. Sum those across your whole pipeline. That number is your weighted pipeline. That's what tells you whether you're going to hit your number this quarter.
The Shipley Pwin model (the math the big firms use)
Shipley Associates is the standard reference for capture management in government contracting. Their model assigns a probability of winning (Pwin) to every opportunity based on where it is in your pursuit lifecycle and how strong your position is.
The baseline Pwin curve looks like this:
| Stage | What it means | Baseline Pwin |
|---|---|---|
| New Match | An RFP you've identified but haven't qualified yet | 5% |
| Reviewing | You've read the RFP, it looks like a fit, you're deciding whether to bid | 15% |
| Preparing | You've committed to bid. The proposal team is working on it. | 35% |
| Submitted | The proposal is in. You're waiting for award. | 45% |
| Won | You've been notified of award. | 100% |
| Lost | The contract went to someone else. | 0% |
The baseline Pwin is your default. From there, you adjust based on opportunity-specific factors:
- +10-30% if you're the incumbent
- +5-15% if you've done past work for this customer in the same NAICS
- +5-10% if you have a set-aside advantage (8(a), HUBZone, SDVOSB, WOSB) that matches the RFP
- -10-25% if there's a strong incumbent you're competing against
- -10-20% if the RFP has wired-contract signals (short deadline, brand-name lock, thin PWS)
- -5-15% if you've never worked with this agency or in this geography
Cap your adjusted Pwin at 95%. Never use 100% — even "sure things" get protested.
A real example calculation
Say you're tracking five opportunities:
- $2M IDIQ recompete, you're the incumbent. Submitted last week. Baseline 45% + incumbent 25% = 70% Pwin. Weighted value: $1.4M.
- $500K state contract, new customer, you're preparing. Baseline 35% + no past-perf -15% = 20% Pwin. Weighted value: $100K.
- $1.2M federal RFP, you're reviewing it, strong incumbent competing. Baseline 15% + strong incumbent -20% = 5% Pwin. Weighted value: $60K. (Probably a no-bid.)
- $800K 8(a) set-aside you just identified. New Match 5% + set-aside match +10% = 15% Pwin. Weighted value: $120K.
- $3M task order, you've already submitted, customer is silent. Baseline 45%, no adjustments = 45% Pwin. Weighted value: $1.35M.
Total weighted pipeline: $3.03M. Total potential if you won everything: $7.5M.
That ratio — weighted / potential = 40% — is your pipeline efficiency. If it's under 25%, your pipeline is mostly aspiration. If it's over 60%, you're probably either being too optimistic about Pwin or you're not feeding the pipeline enough at the top.
Stage conversion rates (the part the spreadsheet doesn't catch)
The Pwin model handles individual opportunities. But your pipeline as a whole has a separate dynamic: how fast opportunities move from one stage to the next, and how many drop out at each transition.
These are your stage conversion rates:
- New Match → Reviewing: typically 30-50%. Most opportunities you identify aren't worth qualifying.
- Reviewing → Preparing: typically 20-40%. Many opportunities don't survive a real go/no-go review.
- Preparing → Submitted: should be 85-95%. If you start preparing and don't submit, something went wrong (scope changed, partner dropped out, you ran out of time).
- Submitted → Won: typically 25-45%. This is your real win rate. Federal averages run lower (15-30%); state and local averages run higher (30-45%).
If you don't know your own conversion rates, use these averages for your first forecast. Once you have 6-12 months of pursuit history, replace them with your actual numbers.
Why this matters: your forecast for "new business closing in the next 90 days" isn't just the sum of your Submitted-stage pursuits. It's also a fraction of your Preparing-stage pursuits that will submit in time, and a smaller fraction of your Reviewing-stage pursuits that will make it all the way through. The conversion rates tell you what to expect.
The stale-pipeline problem (where spreadsheets fail)
Here's the failure mode that destroys most small-contractor forecasts: stale opportunities.
You added an RFP to your spreadsheet three months ago. You marked it "Preparing." Then you got busy. The opportunity sat there. The proposal was never submitted. Maybe the RFP closed. Maybe the customer cancelled. Maybe you decided to no-bid but never updated the row.
In the meantime, your spreadsheet is still telling you that this is a $400K opportunity in Preparing stage with a 35% Pwin — a $140K contribution to your weighted pipeline. That's a phantom. The opportunity isn't real anymore, but your forecast doesn't know.
If you have ten stale opportunities like that, your spreadsheet is showing you $1M+ of pipeline that doesn't exist. You're managing to a number that isn't real, and the moment you actually try to bill against it, you discover the gap.
How to fix the stale-pipeline problem
Three rules:
- Every opportunity needs a next-action date. If the next action is "decide whether to bid" or "draft the technical volume" or "wait for award notification," assign a date by when you expect that action to happen.
- Any pursuit whose next-action date is more than 14 days in the past is presumed stale. It either needs an updated status or it needs to be moved to "abandoned."
- Run a stale-sweep weekly. Open every active pursuit. Confirm it's still active. Update the next-action date. Or close it.
This is the difference between a real pipeline and a graveyard.
Probable value vs. ceiling value (the second math trap)
Most government RFPs publish an estimated value or a ceiling. For task-order vehicles (IDIQs, BPAs), the ceiling is often huge — sometimes $25M or $100M+. But the actual task orders that get released against that vehicle are usually a small fraction.
If you forecast at the ceiling, you're lying to yourself. If you forecast at $0, you're lying the other way.
The right approach is probable value: what do you realistically expect this contract to be worth to your business in the next 12 months? For a 5-year IDIQ with $25M ceiling, that might be $2-4M of task orders in year one. For a firm-fixed-price RFP with a published $500K estimate, the probable value is just $500K.
The Shipley capture manager's rule: probable value <= ceiling value × your realistic share × your year-one fraction. For an IDIQ with 5 expected awardees and a 4-year period of performance, that's roughly ceiling × 0.2 × 0.25 = 5% of ceiling. Adjust based on actual contract structure.
What to forecast (and the time horizons that matter)
For government contracting, the time horizons that matter are:
- 30-day forecast: opportunities currently in Submitted stage. These are deterministic — they'll resolve in 30-90 days regardless of what you do. Forecast = sum of (probable value × Pwin) for all Submitted pursuits, scaled by the fraction expected to award within 30 days.
- 90-day forecast: opportunities in Submitted + Preparing stages. Most of your near-term revenue comes from here.
- 6-12 month forecast: includes Reviewing-stage pursuits. This is where your top-of-funnel feeds your future revenue.
- 12+ month forecast: largely pre-RFP intelligence — recompetes you know are coming, agencies you're building relationships with, set-asides you're tracking. Don't put dollar values on these yet.
The four leading indicators every forecast needs
Beyond the weighted-pipeline number, track four secondary indicators that catch problems before they show up in the forecast:
- Pipeline coverage ratio. Your weighted pipeline / your quarterly revenue target. If you need to close $500K and your weighted pipeline is $400K, you're short. Healthy ratio is 2-4x — you need that much in weighted pipeline to actually book the revenue you need, because not every weighted dollar converts.
- Top-of-funnel inflow. How many new opportunities entered "New Match" or "Reviewing" this week? If your inflow drops below your bid rate, your pipeline is shrinking even if your weighted total looks stable.
- Win rate by source. Track which RFP sources actually produce wins. Federal SAM.gov, state portals, education set-asides — each has different win economics. The source where you win 35% deserves more of your attention than the source where you win 5%.
- Average pursuit age. If your average Submitted-stage pursuit has been sitting there for 90+ days, you have a customer-decision problem. Agencies aren't awarding. Adjust your Pwin downward and your conversion timing assumptions.
Why a spreadsheet eventually fails (and what to use instead)
For your first 5-10 active pursuits, a spreadsheet is fine. It's also fine for educational purposes — building one teaches you the math.
But the spreadsheet stops working when:
- You can't maintain it weekly. Someone has to manually update every cell. The minute you skip a week, your forecast is wrong.
- You can't see history. Closed pursuits get deleted or hidden, and you lose the data you'd need to compute your actual conversion rates.
- You can't share it with a partner or proposal team. One person owns the file. Everyone else works from a copy that's out of date.
- You can't link it to the underlying RFP data. The contract value, due date, agency, and incumbent are all in the RFP — but in your spreadsheet they're static text that ages.
What you actually need is a capture-management system that:
- Pulls the live RFP data automatically (value, due date, status, agency)
- Calculates Pwin based on the stage + adjustment factors
- Shows you the weighted pipeline in real time
- Flags stale pursuits automatically
- Stores notes, files, and decision history per pursuit
- Lets you see your conversion rates by source, agency, set-aside
The big firms use Deltek GovWin's Pursuits module for this. It works. It also costs $10,000-$30,000 per year.
How BidSparq does pipeline forecasting
BidSparq's Pro Max tier includes Pursuits — a capture-management hub built around the math in this post.
For every pursuit you track, BidSparq automatically:
- Pulls the live RFP value, due date, agency, and incumbent
- Calculates a personalized AI fit score (capability match, past-perf, set-aside, geography, complexity)
- Computes Shipley-weighted Pwin based on stage + your contractor profile
- Shows the weighted pipeline waterfall by stage
- Tracks stage conversion rates so you see your actual numbers over time
- Flags stale pursuits (next-action date overdue)
- Stores notes, files, custom capture fields (PoP, POC, win theme, budget), and activity history
It's the same workflow GovWin sells for $10K-$30K/year — included in BidSparq Pro Max at $249/month.
Try BidSparq Pro Max free for 14 days → Build your weighted pipeline in the first hour.
Related reading
- The Bid / No-Bid Decision Framework — how to qualify opportunities before they enter your pipeline
- How to Spot a Wired Contract — six signals that lower your Pwin to near-zero
- Contract vehicle intelligence — 64,849 federal IDVs (GWACs / FSS / BPAs) for pipeline-stage qualification
- How to Bid on Government Contracts — the full procurement workflow
Find RFPs that match your business
BidSparq monitors 14,000+ procurement sources and uses AI to score every opportunity against your capabilities. Try it free for 14 days.
Start Free Trial →