Shipped: Task-order velocity, vendor win-share, and per-SIN GSA Schedule pricing — on every contract vehicle
Three weeks after we shipped the 64,849-vehicle catalog, we added what makes it actually useful for capture decisions: quarterly task-order velocity per vehicle, vendor win-share leaderboards, set-aside utilization breakdowns, per-SIN schedule pricing pages, federal agency market-trend panels, and direct GSA Advantage pricelist links. Four new AI tools wire it all to your chat.
Three weeks ago we shipped the 64,849-vehicle federal contract-vehicle catalog — every active GWAC, GSA Schedule, BPA, IDIQ, and BOA on USAspending, queryable from chat and exposed via MCP. It was a strong foundation. But "here's the list of vehicles" is not the same as "here's whether this vehicle is worth pursuing." Capture managers need to know which ones are actually active, who's winning orders, what vendors charge, and how the agency market is trending.
Today we shipped the second layer: Task-Order Intelligence on every vehicle, per-SIN schedule pricing pages, Federal Market Intelligence on every agency profile, and direct deeplinks to official GSA Advantage pricelists. Plus four new AI/MCP tools so your chat can answer the natural-language version of all of it.
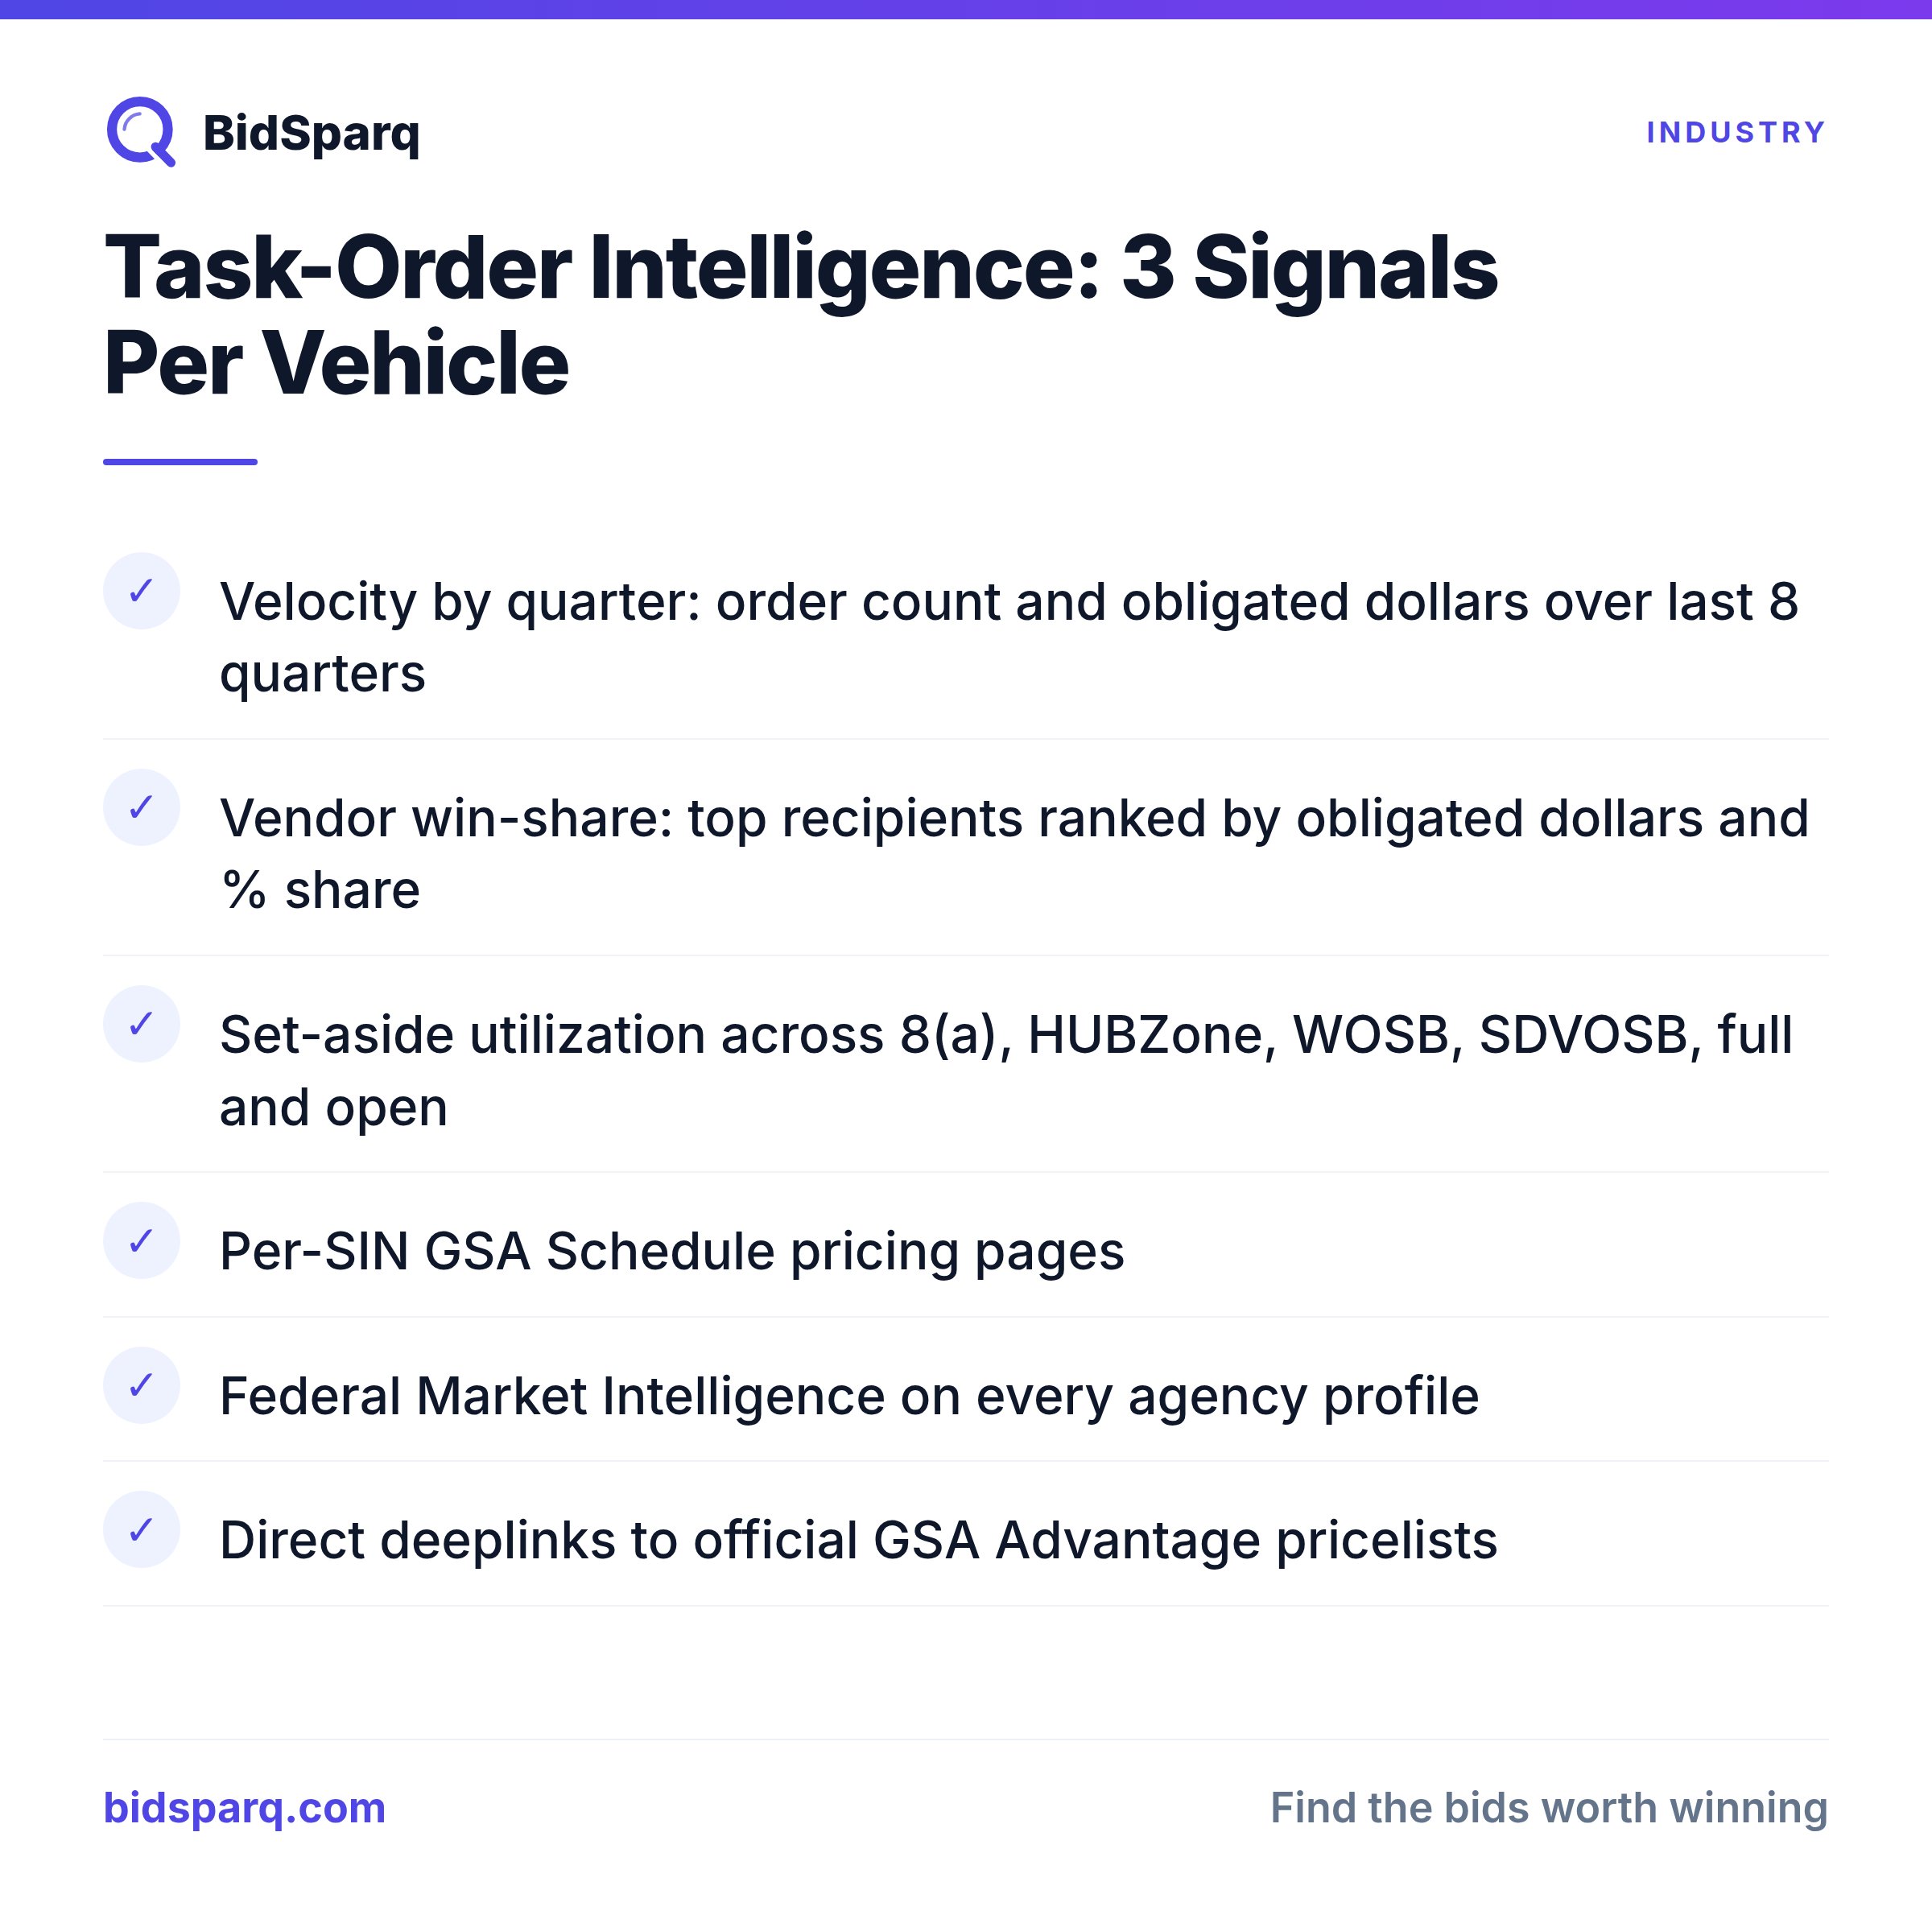
Task-Order Intelligence — on every vehicle
Visit any active contract vehicle page (e.g. /vehicles/CONT_IDV_47QMCA22D000N_4732) and you'll now see a "Task Order Intelligence" panel with three signals:
- Velocity by quarter — order count + obligated dollars over the last 8 quarters. Spot vehicles that are heating up (or cooling off) before the next recompete.
- Vendor win-share — top recipients on this vehicle, ranked by obligated dollars, with the % share they captured. Distinct from the existing "sibling holders" view: that shows who's on the vehicle, this shows who's actually winning orders under it.
- Set-aside utilization — how task-order dollars distribute across set-aside categories (8(a), HUBZone, WOSB, SDVOSB, full and open). Tells you whether a vehicle is small-business friendly in practice, not just on paper.
The panel renders only when we have captured task orders linked to the vehicle. Coverage was 4.5% of vehicles at launch and is climbing as our background USAspending children-ingest runs. When a vehicle has fewer than 5 captured orders, the panel flags a "limited sample" caveat so the numbers don't get over-interpreted.
Per-SIN schedule pricing pages
GSA CALC+ publishes 266,963 labor rates from 6,015 vendors across 3,150 Special Item Numbers (SINs). We already had per-vehicle rate cards and a market-wide "find me the cheapest Senior Software Engineer" tool. New this release: per-SIN deep pages at /schedule/[sin].
Example: /schedule/54151S (IT Professional Services) shows 85,419 published rates from 2,785 vendors across 2,827 vehicles. Median $128.89/hr. P25-P75 range. Top 25 labor categories with their median rates. Top 15 vendors with their median rates and business size.
1,482 SINs have enough rate density to render a useful page. Top 208 (with ≥100 rates) are sitemap-indexed for SEO. The data updates weekly from api.gsa.gov/acquisition/calc/v3.
Per-NAICS contract-vehicle index
Mirror of the SIN pages on the vehicles side: /vehicles/by-naics/[code]. Example /vehicles/by-naics/541512 (Computer Systems Design Services) shows 2,525 active vehicles, $3.5B total ceiling, 2,088 distinct holders, top vendors with vehicle counts, top awarding agencies, set-aside breakdown, and the highest-ceiling vehicles in this NAICS family. 527 NAICS codes get pages; top 317 are sitemap-indexed. Cross-linked from every vehicle's detail page via the NAICS field.
Federal Market Intelligence on every agency profile
Every /agency/[slug] page now ships with a Federal Market Intelligence panel showing the agency's 6-year contract obligation trend (FY-grouped sparkline, with a YoY % change indicator that calls out whether the market is growing, flat, or shrinking) plus the top recipients in the most recent complete fiscal year.
The DoD page shows $320B (FY2020) → $414B (FY2022) → trending growing. Lockheed Martin tops the recipients list at $34B in the most recent complete FY. The data is live from USAspending's spending_over_time and spending_by_category/recipient endpoints, cached 24h. Renders only for federal toptier agencies (~111 of them) — sub-tier strings and state/local agencies return nothing cleanly.
Direct GSA Advantage pricelist links
Every MAS-Schedule vehicle now has a "View official GSA pricelist" CTA on its detail and rates pages. The link points straight to gsaadvantage.gov/ref_text/{PIID}/{PIID}_online.htm — the canonical published price list. Verified pattern: returns 200 on every MAS PIID we've tested. Adds a one-click verification step for procurement officers and capture managers reviewing pricing.
Four new AI tools
Four tools added to the main chat (and the MCP server, accessible from Claude Desktop, Cursor, ChatGPT):
- get_agency_market_intel — the federal market trend + top recipients panel, as a chat tool. "Is the DoD contracting market growing?" "Top vendors at HHS." Returns 6-year trend with YoY direction.
- get_vehicle_velocity — order count + $ by quarter for one vehicle. "How active is OASIS+?" "Is SeaPort getting orders or stalling?"
- get_vehicle_win_share — top task-order recipients on one vehicle. Different from
analyze_vehicle_competition(which shows holders) — this shows winners. "Who's winning task orders on Alliant 2?" - analyze_sin_pricing — full per-SIN aggregate: rate count, vendor count, p25-median-p75, top labor categories, top vendors. "What's the median rate on SIN 54151S?" "Which vendors hold SIN 518210C and what do they charge?"
Main-chat tool count is now 65 (was 61). MCP-exposed: 63. Public-chat: 46.
What this is NOT
Same honesty-first framing as before.
The task-order corpus is not complete. We have ~12K captured children (task orders) linked to ~2.7K distinct vehicles. The full universe is much bigger — USAspending publishes every action but capturing all of it is a multi-day ingest that's running in the background as of this writing. The R3 panel reflects what we've ingested, which is rich on common MAS vehicles and thin on agency-specific IDIQs. Coverage improves automatically as the ingest catches up.
The Federal Market Intelligence panel only covers federal toptier agencies. If you visit /agency/harris-county or any sub-tier agency string in our DB, the panel just doesn't render. It's not pretending to have data it doesn't.
CALC+ coverage is MAS-only. If you're looking at a non-MAS vehicle (DOD, DLA, VA, Army IDIQs), the per-SIN pricing pages won't have it. The vehicle detail page will show this cleanly — no fake "$ —" placeholders.
How to use it
- Browse a contract vehicle and look for the new Task Order Intelligence panel — velocity, win-share, set-aside utilization in one view.
- Click any SIN on a vehicle's rate card to land on the per-SIN deep page.
- Click the NAICS code on a vehicle detail page to see every active vehicle in that NAICS family.
- Visit any federal agency page (DoD, GSA, HHS, VA, etc.) for the 6-year market trend.
- From your AI chat: "Compare task-order velocity on SEWP V and OASIS+." "What's the median rate on SIN 54151S?" "Is HHS contracting growing?"
Related links
- The full contract vehicle catalog
- All BidSparq features
- The original 64,849-vehicle catalog launch — context for this release
- Beacon — the buyer-side contact graph
- MCP setup — use all 63 tools from Claude Desktop, Cursor, or ChatGPT
Find RFPs that match your business
BidSparq monitors 14,000+ procurement sources and uses AI to score every opportunity against your capabilities. Try it free for 14 days.
Start Free Trial →